
Classifying and Measuring Realized Value from AI
Business Mission: Value starts with why the business exists
Before any measurement: what does your business or team produce, or you individually? What would count as a positive outcome from the outside? Every estimate and measurement below should be downstream of that answer. Locate your own role to play in driving value, because an individual contributor, a manager, a director, a VP, and the C-Suite all answer the same question at different scales with different units.
This methodology is deliberately generic. It does not specify what to measure or how, only an overview of methods that are flexible across industry, function, and role.
The numbers this methodology produces are value claims, not returns or ROI. A value claim is a defensible statement about the incremental benefit of an outcome, measured or estimated against a baseline. ROI additionally requires cost in the equation, ideally Total Cost of AI (TCA). See What comes next.
| Role | The value question at this scope | Typical estimate unit |
|---|---|---|
| IC | What tasks do I perform, which ones is AI changing, and what does my time produce? | hours per task, output per week, FTE fraction |
| Manager | Which team outcomes does AI accelerate, and is additional capacity available against the plan? | team FTE-equivalents, dollars at loaded cost |
| Director | Which projects or capabilities can the org now deliver that it could not, and what spend or headcount plan does that move? | dollars across budget lines, headcount plan delta |
| VP | How does the org's output show up in business results: growth, margin, risk posture? | P&L lines, dollars |
| C-Suite | Why does the business exist, and is AI improving the reason? | whole-business revenue, market position |
The audience picks the unit; the framework does not prescribe one. The ladder reads in both directions: an executive starts from the business objective and works down to the measure that proves it, whereas an individual on the ground starts from an observed change and works up to what it is worth. Estimates add up within a role's scope, not across scopes, to avoid double-counting.
Financial Treatment: Different AI uses require different treatment
The next question is what kind of AI you are introducing. Product AI and Internal AI generally require different treatments, and the examples under each are the task types and workflows businesses commonly implement AI in. That decision informs how you action changes but it does not change the measurement math. For example, productivity improvements sold to customers can still be measured in the same way as those delivered to internal teams, but the outcomes to the business would be tracked differently.
Product AI
Customer-facing features, judged on growth, margin, and customer outcomes. Financial treatments: sometimes COGs or Opex Applying cost-reduction discipline here starves the investment that was supposed to generate returns.
ExamplesInternal AI
Operational tools, judged on cost reduction, efficiency gains, and new capability. Financial treatments: sometimes capitalized R&D or Opex Getting this split wrong sends the whole measurement chain to the wrong scoreboard.
ExamplesEdge case: a workload that resembles an Internal example but is sold to customers belongs under Product AI. The test is who consumes the workload.
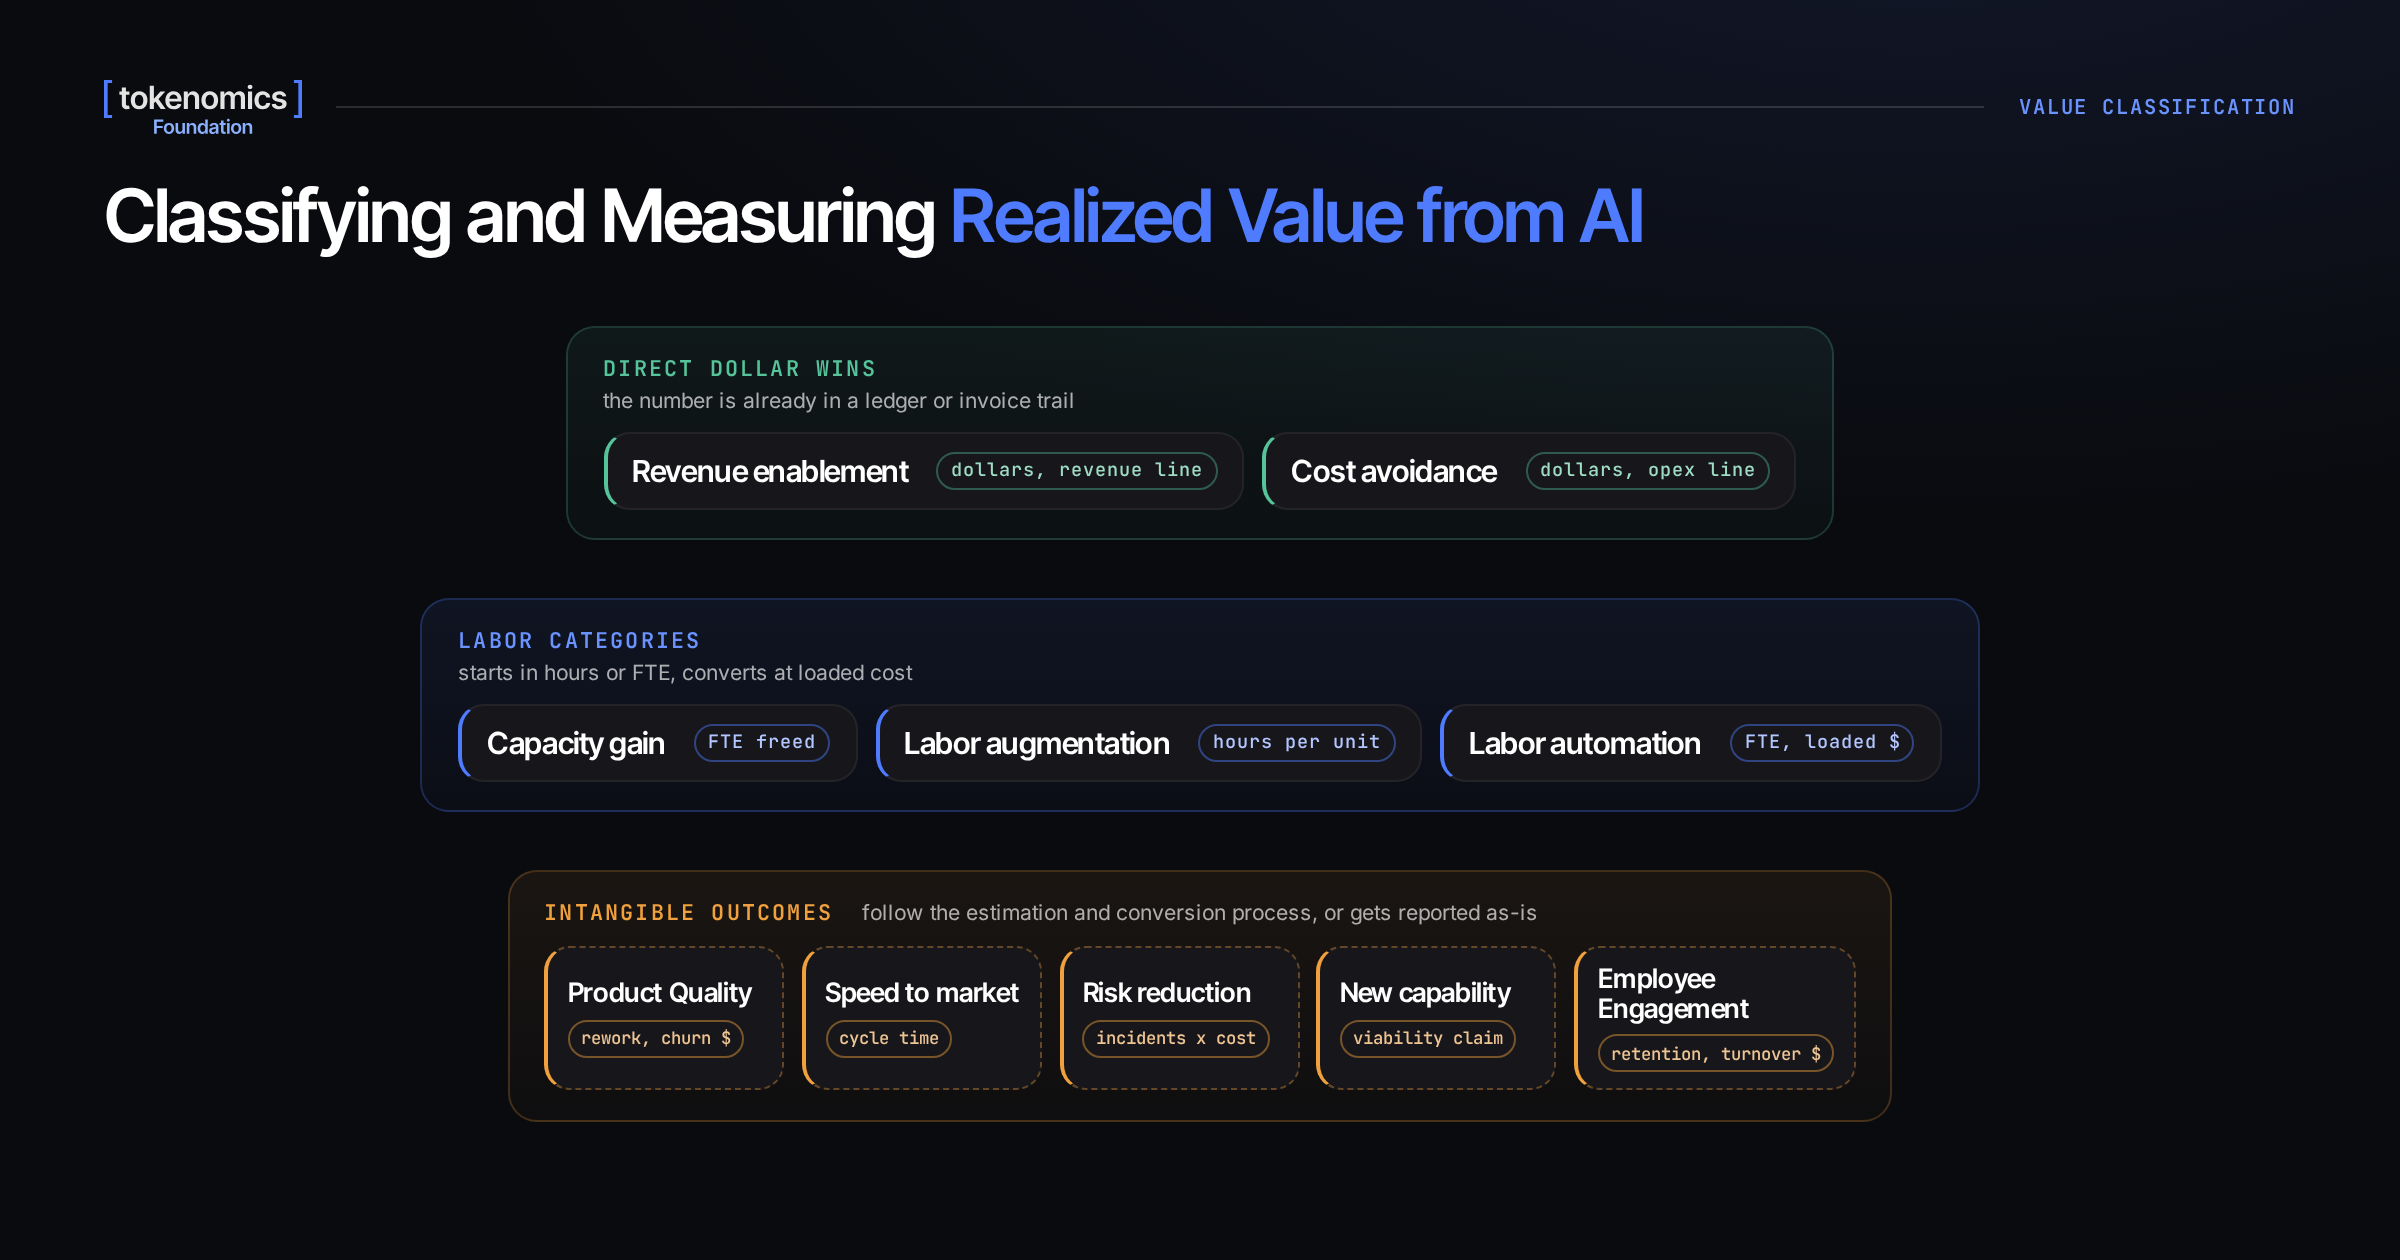
Outcome Categories: The value classification
Outcomes are what the AI produces, once you know the business anchor and the treatment. A workload usually produces outcomes in several categories at once, with different levels of impact or confidence in each, and every category the workload touches is reported. The groups differ in how the number is produced, not in their worth: a direct dollar win might be easier to measure but can be superseded in impact by labor gains in the middle, or intangible outcomes on the far end. No category here outranks another. "Estimate as" provides examples of units, but use your preferred unit of measure and stay consistent. Note that several categories can be reported for one workload. A dollar can only be booked once: when two categories convert to the same dollar, one destination in the ledger is chosen where one team books it, and the other category stays simply reported, but not booked.
Direct dollar wins, The number is already in a ledger or an invoice trail.
Revenue enablement
Revenue that would not exist without the AI. The number sits in a ledger; the challenge is attribution, not measurement.
Estimate as: dollars, revenue lineCost avoidance
Spend that does not occur. Spend that went down is visible on an invoice; spend never incurred is a counterfactual.
Estimate as: dollars, opex lineLabor categories, The estimate starts in hours or FTE and converts at loaded cost.
Capacity gain
Same people produce more. Individually nice-to-haves; in aggregate often the largest line. For a non-profit or mission-driven organization (e.g. Public sector or government) this is usually where the gain lands: the same staff deliver more of the mission, measured in the organization's own output unit, such as cases handled or grants processed.
Estimate as: FTE-equivalents freed, or mission output per periodLabor augmentation
AI does part of the task and the human stays in the loop. The type of work may shift to management or review. The gain shows up as throughput or hours per unit before it ever shows up as headcount. Compare against the human alone.
Estimate as: hours per unit, FTE fraction, then dollarsLabor automation
AI does the task end to end. Trivial to compute, hardest to defend: it needs the best-of-either baseline and the Quality Floor applied before counting, and it raises who owns the decision once the human is out of the loop, and what the freed people move to.
Estimate as: FTE headcount, dollars at loaded costIntangible outcomes, Further removed from direct benefit, each has to travel the chain in Step 4, or be reported as-is.
Product Quality
Fewer defects, less rework, better product. This is the quality of the work the business ships.
Estimate as: rework cost, customer satisfaction, refund or churn dollarsSpeed to market
Measurement of cycle time is usually possible; but what a week of earlier delivery is worth usually is harder. Early delivery could resolve as revenue pulled forward or spend avoided.
Estimate as: cycle time, then revenue or dollarsRisk reduction
Security incidents prevented, product outages avoided, compliance failures caught earlier. The value is a loss that did not occur; the claim rests on an expected-loss estimate: for example, incident rate x incident cost.
Estimate as: incidents per period x cost per incidentNew capability
Something not previously possible. There is no prior state to measure against, so the claim is about viability rather than delta: name the alternative you chose not to build. The counterfactual is the baseline: what it would have cost, or whether it would have shipped at all.
Estimate as: viability claim, then revenue dollarsEmployee Engagement
How the people using the AI respond to the change: retention, engagement, and counterproductive work behaviors such as withdrawal or sabotage. It is estimated the same way as the other categories in this group: survey deltas, turnover rates, and the cost of replacing the people who leave. AI change management is a social and economic outcome of the deployment, and this category is where it is estimated.
Estimate as: retention rate, survey delta, then turnover cost in dollarsDo not drop the categories that where quantitative measurement is difficult. Capacity gain and new capability can carry more overall business value than cost avoidance, yet they are among the most often dropped from an ROI case.
Measurement and Conversion: The claim chain
Whatever your role's scope, the chain looks similar and has four parts. Observe gathers the inputs, all in one unit. Net turns them into one number in that unit. Convert carries the net number into another unit if the audience needs one, and can repeat. Book names where a dollar-denominated result lands in the ledger. Many claims stop after Net, and a claim that stops there is complete.
For example: a task drops from 30 minutes to 20, with a floor and a triage cost recorded alongside (Observe). Multiplying the saved minutes by task volume, less the outputs that missed the floor and the triage time, gives net hours (Net). Applying the average fully loaded employee cost turns those hours into dollars (Convert). Finally, choose the budget line the dollars land on (Book).
Observe
The inputs
Net
One number
Convert
The conversion
Book
The destination
Observe, you measure itThe inputs
Every input is denominated in the baseline's unit. If it cannot be expressed in that unit, it is not an Observe input: it is either a Convert operation or it is Total Cost of AI (see What comes next).
- Scope. The workload, the period, and the mix of work the claim covers.
- Baseline. What the metric looked like before, in a named unit, over the same period and the same mix of work as the claim.
- Observed state. What the metric looks like now, same unit, same period, same mix. The difference between baseline and observed state is the delta: a metric with a unit and a direction. Hours per resolved ticket, down. Defects per release, down. Reviewed pull requests per engineer per week, up.
- Quality Floor. What makes an output count as finished at all, plus the rate at which outputs clear it. Only outputs that clear the floor enter the count.
- Cost created. Review, triage, rework, supervision, and escalation that the AI adds inside the workload, written in the baseline's unit. A cost that cannot be written in that unit or a unitless ratio (like a percentage) is not an input here.
- Provenance. A mark on each input: measured, sampled, or estimated.
Automate 900 of 1,000 tasks and 100 come back rejected, and the honest count is 800, less the effort of fixing the rejects. If the rejected 100 were the hardest tasks, counting 900 overstates the saving twice: once for the rejections, once for the easy-tasks-only baseline. The floor is set per workload, before the estimate, because it is part of measuring, not part of selling the number.
Open in the working group: when a baseline retires. As AI capabilities rapidly evolve, choosing a relevant baseline can be a challenging step on its own. A proposal would reset the baseline clock only on big events, a stack migration or a model-mix rationalization, rather than on incremental improvement.
Net, you count itOne number
Net produces one number, in one unit, over one period, with one confidence mark. It is the first point at which a claim exists.
Two of these lines need a word.
Harm from misses. The Quality Floor makes bad output not count. It does not make bad output cost anything. Those are different operations. An incorrect support resolution, a bad routing decision, or a compliance miss is net negative, not merely zero, and the damage is subtracted here in the baseline's unit. Most claims will carry zero on this line.
Redeployment. Freed capacity that was not redeployed nets to zero realized benefit. It is tracked as an FTE estimate, not claimed, until the capacity is spent on work that produces an outcome. This applies to every labor category, not only capacity gain.
The confidence mark carries the weakest provenance among the inputs: a net built on one estimated input is an estimated net.
Convert, you defend itThe conversion
This is the part that turns a net observation into hours, headcount, or money. Conversion here means turning a net delta into an estimate in another unit. It can repeat more than once. For example, converting a reduction in low-priority product defects into an increase in customer satisfaction, and into an increase in customer retention, and finally into an estimate of dollars of revenue avoided from customer churn.
Three rules govern the conversion.
- Conversion operates on the net and never on the gross.
- Each hop carries its own confidence, and confidence compounds downward. A chain of three estimates is less certain than any one of them.
- The claim names its hop count. A claim beyond the hop threshold the organization sets is reported, not booked. The worked example below treats three estimation hops as the point to report rather than book; no standard threshold is set.
Timing is part of the conversion too: an efficiency delta is measurable as soon as the work changes, while the revenue-side outcome it feeds may take far longer to land in some industries than in others.
Defensibility lives here, not at the destination.
Open in the working group: whether conversion to dollars is optional or mandatory. This document treats it as available: a team that manages in time can stop at Net and report hours or FTE-equivalents. Teams estimating in different units will need to coordinate so a freed hour is never quietly counted as a booked dollar.
Book, Finance books itThe destination
Only a dollar-denominated result can reach a destination. A claim that stops at Net, or converts into a non-dollar unit, is reported and has no destination.
Once the number is in dollars, these are the places it can land. There are five, and only five, and these cards cover every place a dollar can land on them: revenue, cash out, cash flow, the balance sheet.
The evidence marks say what kind of argument each claim requires: a ledger line points at a number already in the books; a counterfactual claims a cost or revenue that never happened; an expected loss prices a risk that did not land; attribution concedes the number exists but argues the AI caused it.
New revenue won
P&L, revenueBusiness or price that would not exist without the AI. The number is already in a ledger, so the argument comes down to attribution.
Revenue retained
P&L, revenueRetention held, or churn avoided, or revenue pulled forward. Three evidence types share this card, and a claim has to say which one it is using.
Spend removed
P&L, cash outAn invoice, license, server, or contract that actually stopped. An unambiguous evidence type, when the prior spend is removed.
Spend avoided
P&L, cash outA cost never incurred. Deterministic, a project you did not have to fund, or probabilistic, an expected loss. Risk claims are always the second.
Capital freed
Cash flow, balance sheetWorking capital released, capacity not purchased, capital expenditure deferred.
Real World Example: An AI Code Review Assistant, End to End Value Classification
One workload, walked through all four steps. The numbers are illustrative placeholders, not a case study.
A technology company of 40 software engineers ships through pull requests. The team's bottleneck is code review: a median of three days from "ready" to "merged", with each review taking a human reviewer 45 minutes on average. The team decides to evaluate an AI code review assistant that comments on every new pull request; humans approve or dismiss each comment, and no PR merges without a human sign-off.
The business exists to ship reliable software customers pay for; the team's piece is flow of features into production without quality regressions. Positive outcome from the outside: features arrive predictably, and production does not break. The VP's number is delivery lead time; the IC's is minutes per review.
Internal AI, decision support: the assistant serves colleagues, not customers. The scoreboard is cost and efficiency, and the measurement math would be identical if the same assistant were sold to customers as a product.
Capacity gain (human review minutes per PR, down), Product Quality (defects escaping to production, down, if the floor holds), and Employee Engagement (are employees happier reviewing less code? Do they trust the assistant too much?). One workload, three categories, and the same PR sits under two of them: that overlap is why only one of the three may end up as a booked dollar.
Step 4, the claim
The delta: human review time per merged PR drops from 45 minutes to 10. The claim needs two more numbers before it means anything. The Quality Floor: an AI review "counts" only if its comments survive engineer triage at a better-than-chance rate; over the first month, 30% of comments are dismissed, so the assistant's real throughput is 70% of its nominal output, and the 10 minutes does not include the 8 minutes of triage time. The baseline: the 45 minutes was measured over the same quarter, on the same mix of PRs. With the triage time counted as cost created, the saving is 27 minutes per PR, not 35.
- For the engineering manager, it stops after one Convert hop: 27 minutes times about 200 PRs a week is roughly 90 hours, about 2 FTE-equivalents, reported as capacity, not dollars. The PR queue was the constraint and the backlog absorbed the freed hours, so the capacity gain is real work delivered, not idle time.
- For the VP, a second conversion: the assistant license costs less per quarter than two contract reviewers, and the queue clears without them. 2 FTE-equivalents at loaded contractor rates prices the decision.
The VP books the quarter against Spend Avoided, marked counterfactual: the contract was never signed, so the claim is "a cost never incurred," and the evidence is the hiring plan that was shelved plus the cost of the license invoice that replaced it. The Manager's 2 FTE-equivalents are not also booked: that's the same win, already counted. The Product Quality category line, defects escaping per release falling from 2.1 to 1.6, stays unconverted this quarter: the sample is small, and converting escapes into churn dollars would take a chain of three estimates, each with error bars. It is reported as an outcome, and revisited once Customer Churn, the lagging indicator, can be measured directly enough to carry the conversion.
The workload touched three categories and one destination; the Manager and the VP read the same delta in different units, both defensible; the Quality Floor and the cost created reduced the outcome number before any conversion happened; and the double-counting rule had teeth: capacity, quality, and dollars all described one assistant, and finance saw one number, once.
| Who reads it | The number they get | Unit | Destination |
|---|---|---|---|
| Engineer (IC) | Minutes of human review per PR | 45 to 18 (10 review + 8 triage) | none, stops at Observe |
| Eng manager | Review capacity freed, queue absorbed | ~2 FTE-equivalents per week | none, stops at Convert |
| Platform VP | Contract reviewers not hired | quarter over quarter | Spend avoided, counterfactual |
| Quality owner | Defects escaping per release | 2.1 to 1.6, small sample | reported, conversion deferred |
What comes next: marrying total cost of AI to value outcomes
The work in this document simply provides a starting point for quantifying value and outcomes. This section draws the cost boundary a claim stops at, describes what the future state looks like, and names where each remaining piece is being built.
The cost boundary
Two kinds of cost sit near a value claim, and the unit tells them apart.
Cost in the baseline's unit
Review, triage, rework, supervision, and escalation that the AI adds inside the workload. If the baseline is 45 minutes of human review per pull request, eight minutes of comment triage is also human review time. It is an Observe input and subtracts at Net, before any conversion.
Cost in another unit
Tokens, GPU hours, power, licenses, and the labor to build and operate the AI platform. None of these can be written in the baseline's unit, so none of them can enter the claim. Together they are Total Cost of AI (TCA), which is a work-in-progress.
Attribution grain
For a booked outcome and TCA to eventually assemble together into ROI, both numbers need to share the same workload boundary. The value side typically defines the grain, as AI cost telemetry can be very detailed. Think about how your workload and value measurements could be scoped in a granular way, such as by time, user, department, feature, or any combination thereof.
A cost written in the baseline's unit nets inside the claim. A cost in any other unit is part of Total Cost of AI, and would be used to determine ROI.
Maturity staging
Crawl, walk, run describes how far a claim travels today and what the future state looks like. This document helps a claim reach the Walk stage.
Crawl
A net delta in native units, with a stated baseline and floor. Stops at Net.
Walk
Adds the conversion chain and a named destination. Runs through Book.
Run
Composes the claim against Total Cost of AI for a return on investment (ROI).
Where the work continues
Measurement and Value WG (joint with FinOps Foundation)
This working group will pick up where this document leaves off: measurement of AI usage and outcomes, with the attribution detail that joins them. The metric starter sets and time-savings estimation methods referenced under Observe will be built here.
Total Cost of AI
The cost the AI consumes, assembled at the workload grain this document requires, so that a claim and a cost compose. Its first recorded piece is the Consumption WG's FOCUS 1.5 usage-field research, below.
FOCUS 1.5
This project is developing the initial AI cost data specification a TCA figure is built from. Project page: FOCUS 1.5, AI and token cost specification.
Return on AI investment
The composition of a booked value claim with TCA at the same grain. Not defined here; it is the Run stage above and depends on the two items before it.
Published by the Tokenomics Foundation as an open, vendor-neutral resource. CC BY 4.0.
Thanks to all of the members of the Value Working Group for Sprint 1: Alan Hand, Ali Hosseini, Brian Nathanson, Brendan Piccione, Colin Jack, Crystal Hu, David Tepper, Ioana Adelina Apretei, Jacek Migdal, Joe Dahlquist, Kevin Wade, Kevin Wehde, Maida Nazifi, Matt Small, and Vitaly Belyasov.